You’ve seen the RSI line, you’ve heard the 70/30 rule — but what does RSI really mean in trading?
In this post, we’ll explain the true meaning of the Relative Strength Index (RSI), how it works, and how to use its values to understand market momentum.
What Does RSI Stand For?
RSI stands for Relative Strength Index. It’s a momentum indicator used in technical analysis to measure the speed and magnitude of recent price changes.
Developed by J. Welles Wilder, it helps traders identify overbought and oversold conditions.
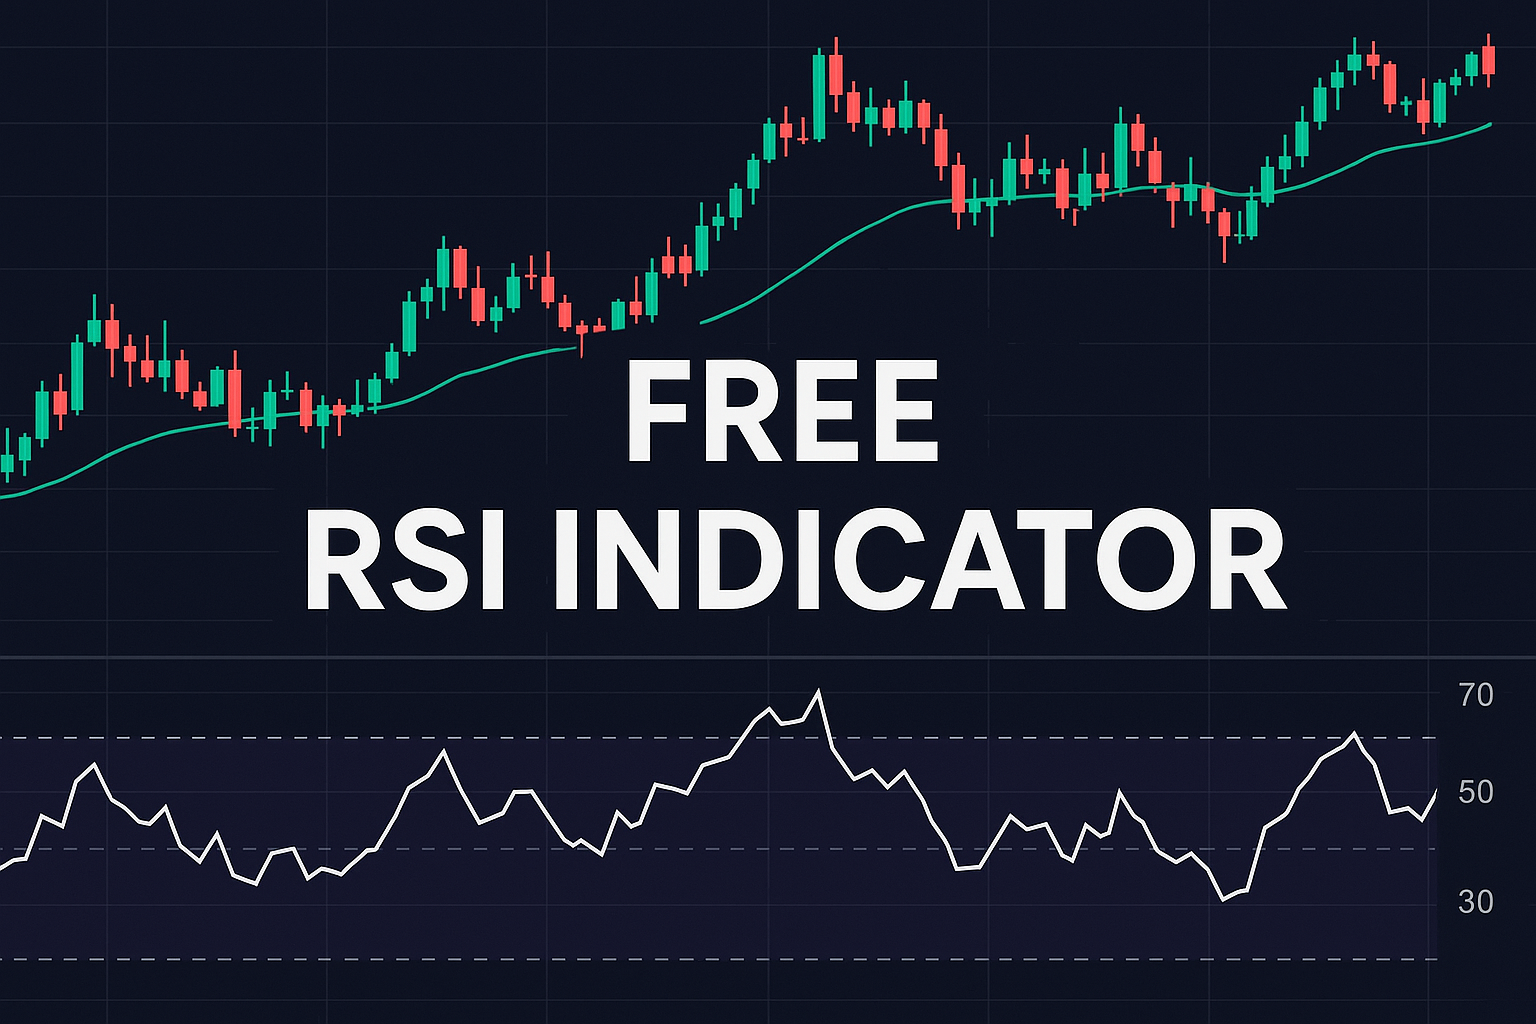
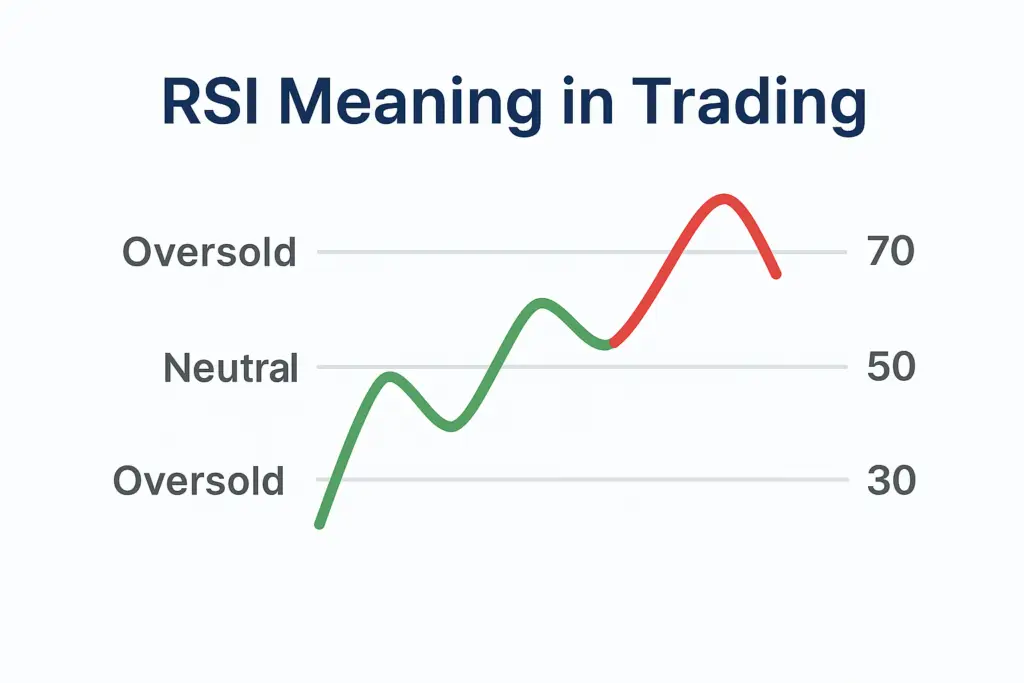
RSI Value Scale – What the Numbers Mean
RSI values range from 0 to 100 and indicate how strong recent price action has been:
- Above 70 → Overbought (may reverse downward)
- Below 30 → Oversold (may reverse upward)
- Between 30–70 → Neutral (no strong signal)
These levels give traders a quick way to assess whether an asset is overextended in one direction.
RSI Meaning Based on Levels
- RSI = 50 → Market is balanced
- RSI > 70 → Buying pressure is strong, but risk of pullback increases
- RSI < 30 → Selling pressure is heavy, but buyers may step in soon
The key meaning behind RSI is momentum — how strong and fast the current move is.
What RSI Tells You About Market Strength
- High RSI = Strong bullish momentum
- Low RSI = Strong bearish momentum
- Divergence = A warning sign of weakening momentum (price up, RSI down)
It helps traders make better timing decisions instead of chasing late entries.
RSI Meaning in Different Markets
- Stocks: RSI helps detect when a stock is overbought after strong earnings or hype
- Crypto: Useful in spotting price spikes and corrections
- Forex: Helps confirm entry points in range-bound conditions
- Futures: Assists in timing scalps and reversals
Conclusion
RSI meaning goes beyond just numbers — it reflects the market’s emotional state. Overbought doesn’t mean “sell now” and oversold doesn’t mean “buy now” — but RSI helps you anticipate what could happen next.
🔍 FAQs
Does RSI predict future price?
No — it reflects current momentum, but helps you anticipate potential reversals.
What is the ideal RSI level?
There’s no fixed ideal. 70 and 30 are common thresholds, but context matters.
Can RSI be used for all assets?
Yes — RSI is universal and works well on any chart that shows price history.