The RSI (Relative Strength Index) is one of the simplest yet most effective tools in a trader’s toolbox. Whether you’re trading stocks, crypto, forex, or futures, understanding how to use RSI can help you make smarter trading decisions.
This guide will walk you through RSI usage step by step — no complex theory, just actionable insights.
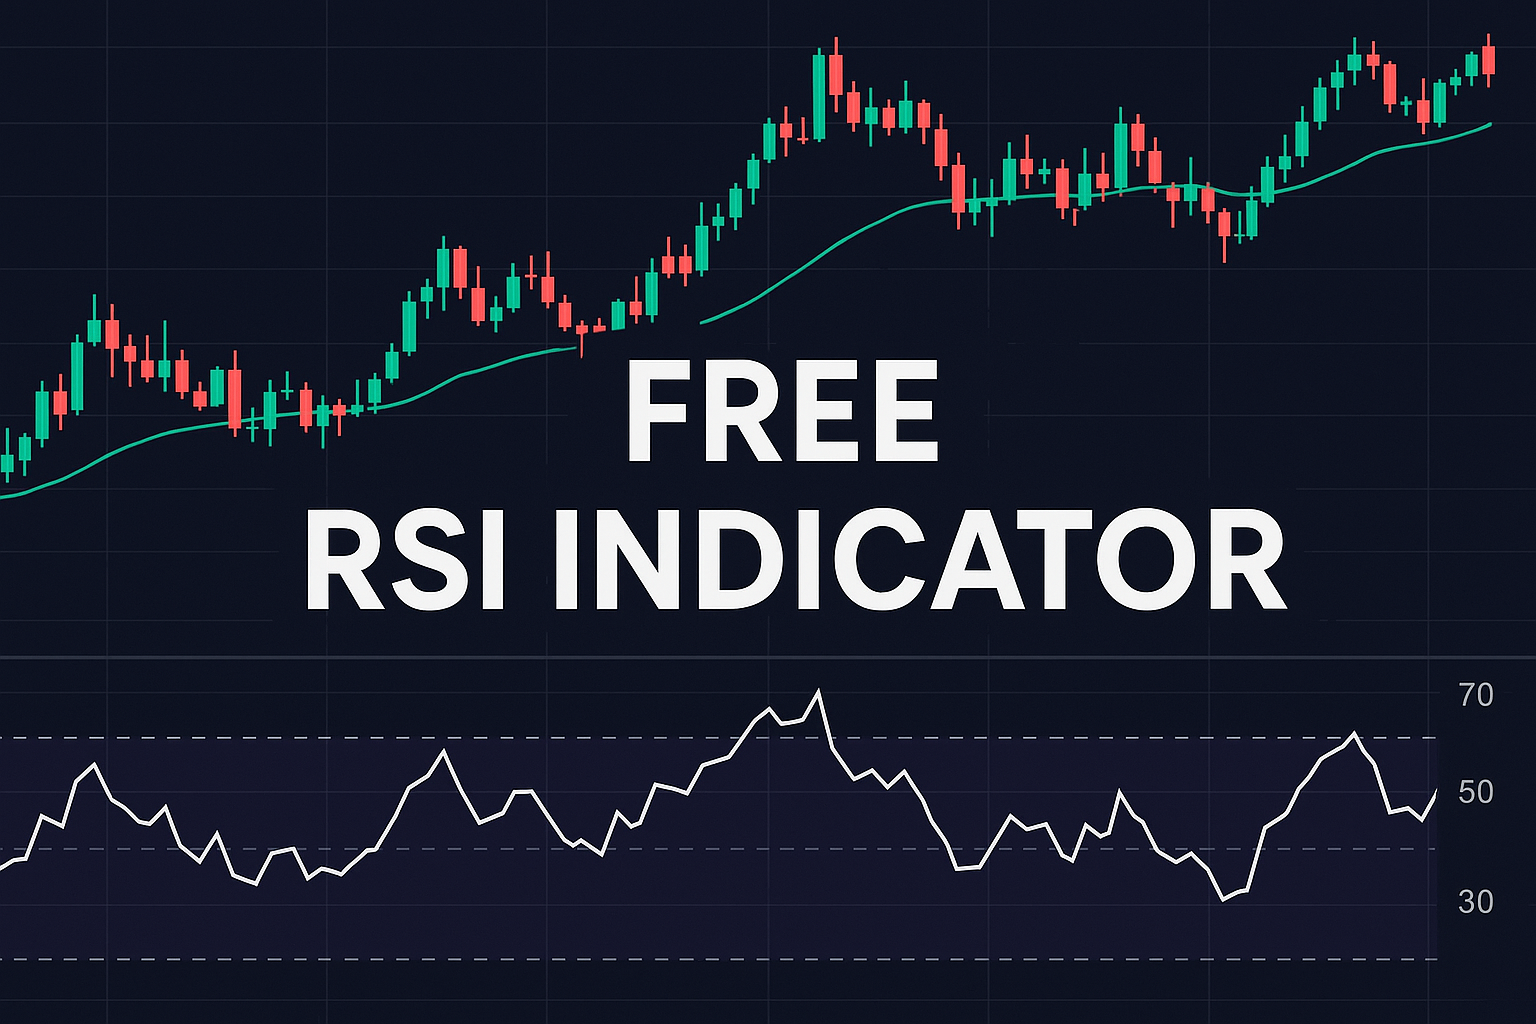
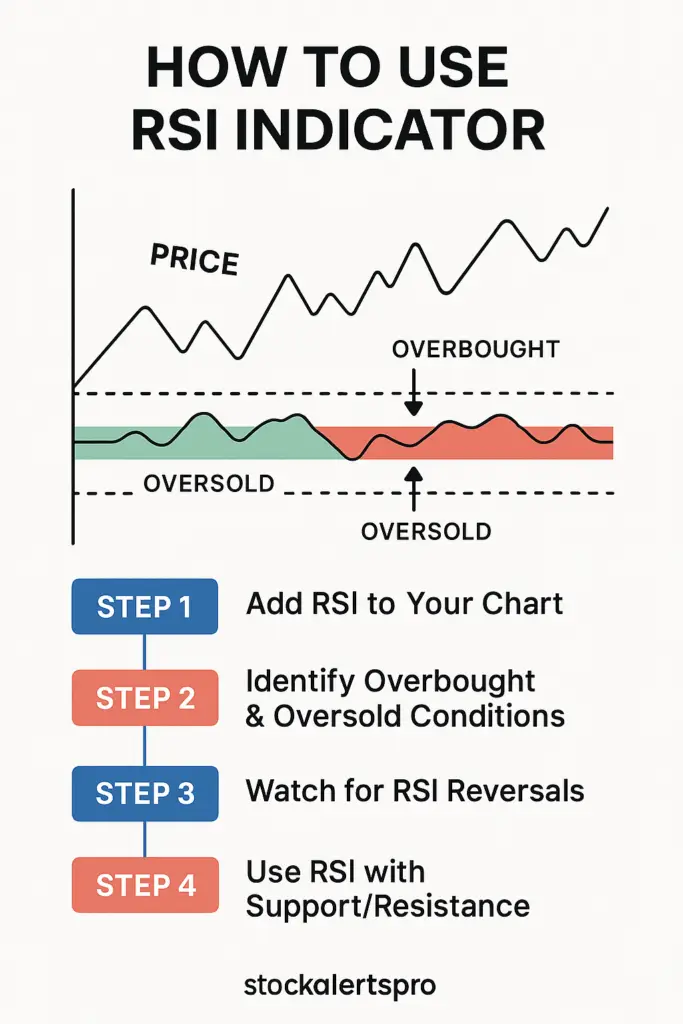
Step 1: Add RSI to Your Chart
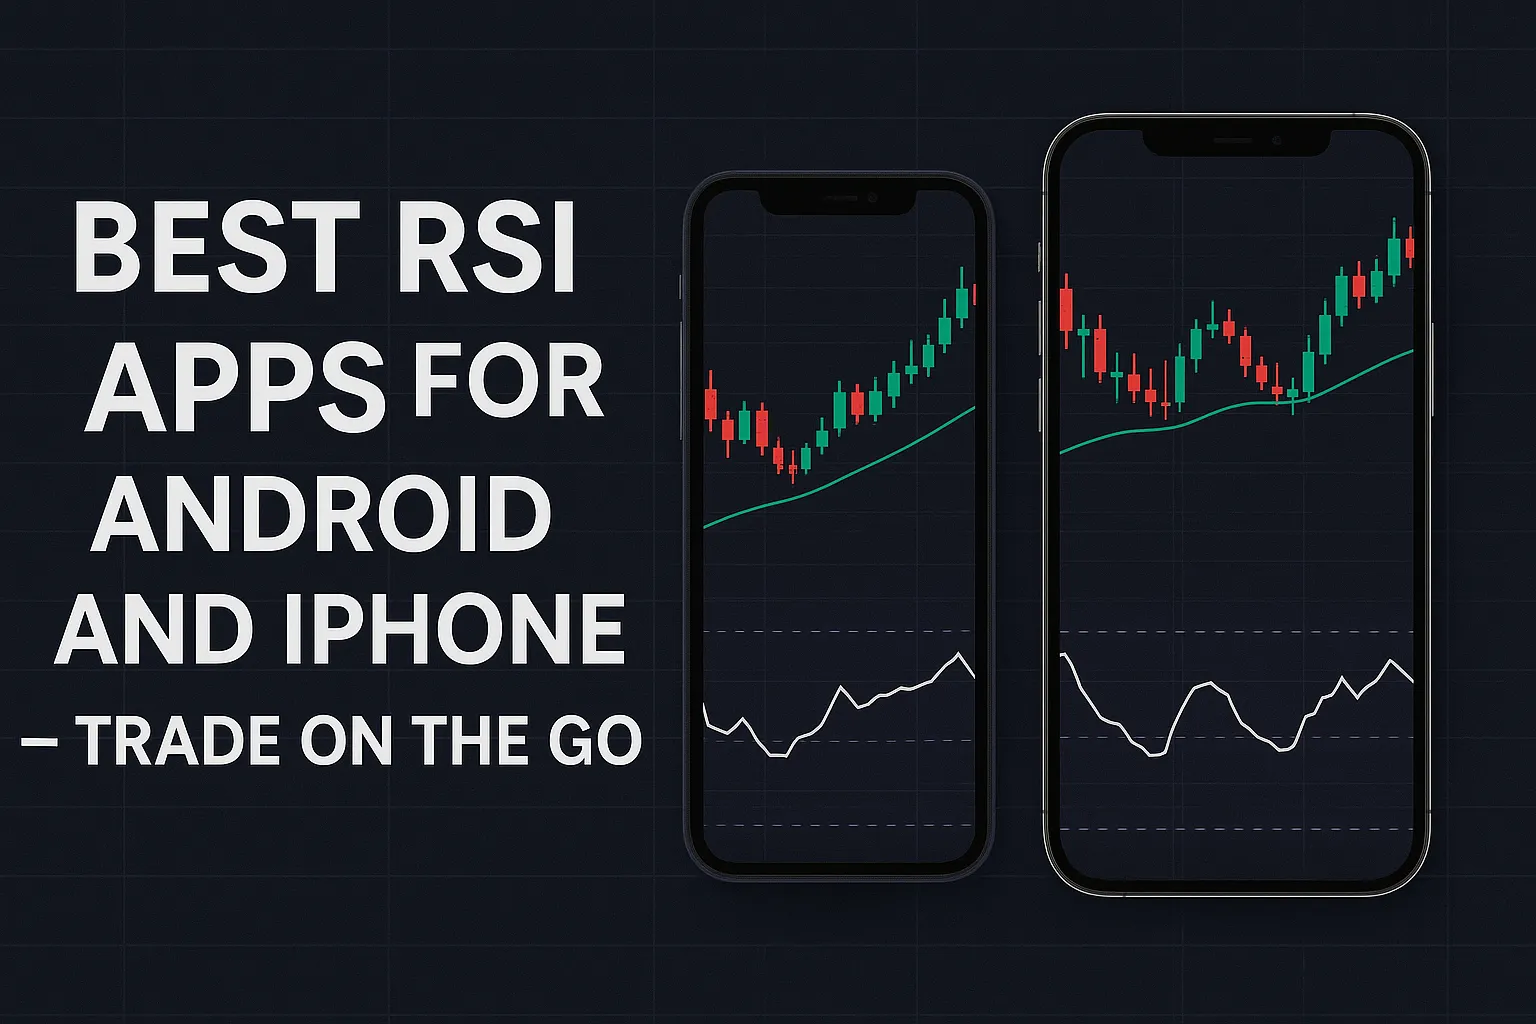
Most platforms like TradingView, MetaTrader, or broker apps let you add RSI easily.
- Open your chart
- Click Indicators > RSI
- The RSI line will appear below the price chart
Default settings:
- Period: 14
- Overbought level: 70
- Oversold level: 30
Step 2: Identify Overbought & Oversold Conditions
- RSI above 70 → The asset might be overbought (price could drop)
- RSI below 30 → The asset might be oversold (price could rise)
These zones give you early warnings about potential reversals.
Step 3: Watch for RSI Reversals
- When RSI crosses below 70, it may signal a sell opportunity
- When RSI crosses above 30, it may signal a buy opportunity
These reversals help you catch trends before they fully form.
Step 4: Use RSI with Support/Resistance
Combine RSI with price levels:
- RSI < 30 near support → Buy setup
- RSI > 70 near resistance → Sell setup
This increases the accuracy of your entries.
Step 5: Look for RSI Divergence
Divergence occurs when RSI moves opposite to price.
- Bullish Divergence: Price makes lower lows, RSI makes higher lows → Uptrend likely
- Bearish Divergence: Price makes higher highs, RSI makes lower highs → Downtrend likely
Divergence is a strong reversal signal, especially near extreme RSI levels.
When Not to Use RSI Alone
- During strong trends, RSI can stay overbought/oversold for a long time
- Avoid taking signals blindly — always confirm with price action or trendlines
Conclusion
RSI is a powerful momentum indicator — especially when combined with support/resistance, divergence, and price confirmation. Learn to read it, and you’ll have an edge in any market.
🔍 FAQs
Should I use RSI alone?
No. It’s best combined with price action or other tools.
Which timeframes work best with RSI?
15M, 1H, and 4H are great for most assets. Intraday traders may prefer 5M or 1M with shorter RSI settings.
Is RSI useful for beginners?
Yes — it’s one of the easiest and most visual indicators to understand.