The RSI (Relative Strength Index) isn’t just a technical number — it’s a simple and powerful tool that shows you when to buy low and sell high. In this guide, you’ll learn exactly how to use RSI to spot high-probability trading signals.
What Are RSI Buy and Sell Signals?
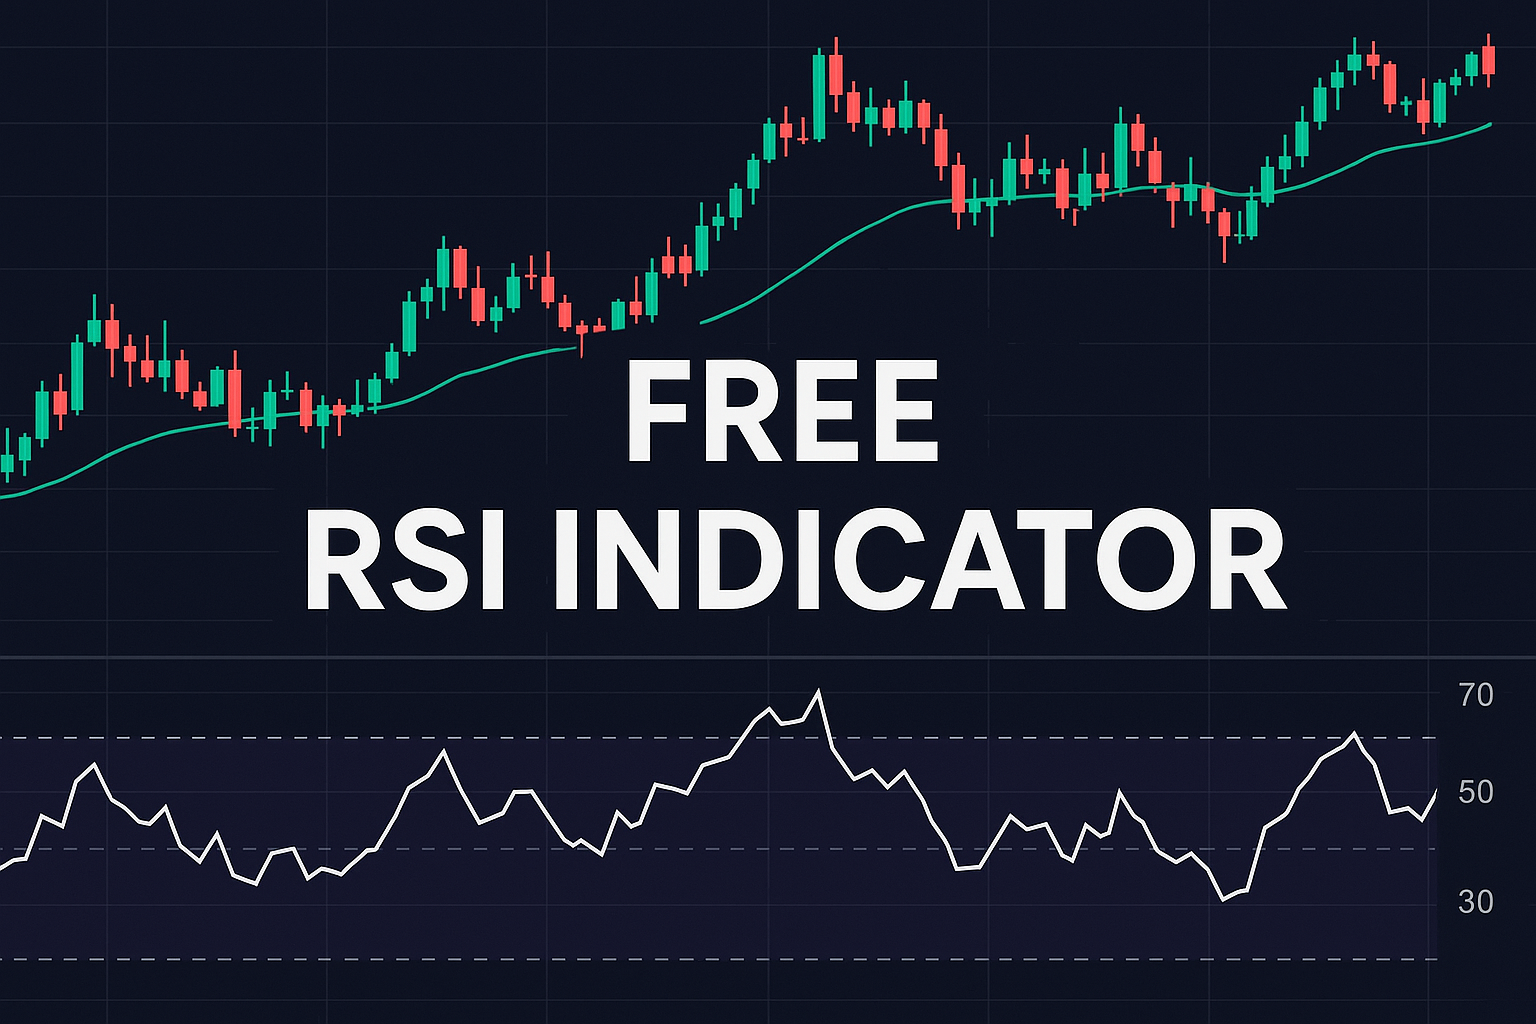
RSI buy and sell signals are based on the indicator’s position on the chart — typically on a scale from 0 to 100.
- Buy Signal: RSI drops below 30 and then rises back above
- Sell Signal: RSI rises above 70 and then falls back below
These signals suggest that price momentum is reversing.
How to Read RSI Buy Signals
A buy signal occurs when:
- RSI drops below 30 (oversold)
- Price is near a known support level
- RSI starts rising again — often crossing back above 30
This setup suggests the asset may be undervalued and could be ready to bounce.
📈 Example: Bitcoin RSI drops to 28, forms a support base, and RSI climbs to 35 — this could be a valid entry point.
How to Read RSI Sell Signals
A sell signal occurs when:
- RSI rises above 70 (overbought)
- Price hits a resistance zone
- RSI reverses and drops back below 70
This setup indicates the asset may be losing strength and could correct or drop.
📉 Example: A stock’s RSI reaches 75, then dips to 68 while price stalls — this may be a good time to exit or short.
RSI Signal Tips for Accuracy
- Use candlestick confirmation (e.g., bullish engulfing near RSI 30)
- Combine with support/resistance levels
- Avoid taking signals during strong trending markets
- RSI works best in sideways or consolidating markets
RSI Divergence Signals (Bonus Strategy)
Divergence is when price moves in the opposite direction of RSI:
- Bullish Divergence: Price makes lower lows, RSI makes higher lows → possible reversal up
- Bearish Divergence: Price makes higher highs, RSI makes lower highs → possible reversal down
This can strengthen your RSI signal and improve timing.
Conclusion
RSI signals are simple, visual, and powerful — especially when combined with price action. Always confirm signals with market context, and avoid blindly buying or selling just based on numbers.
🔍 FAQs
What is the best RSI level to buy?
Look for RSI below 30 for potential buying opportunities — but confirm with other tools.
What is the best RSI level to sell?
Above 70 is a warning sign. Look to exit or short when RSI crosses back down.
Can RSI signals fail?
Yes. In strong trends, RSI can stay overbought/oversold. Always use support/resistance to confirm.
Do RSI signals work on all timeframes?
Yes, but the reliability depends on market structure and volatility.