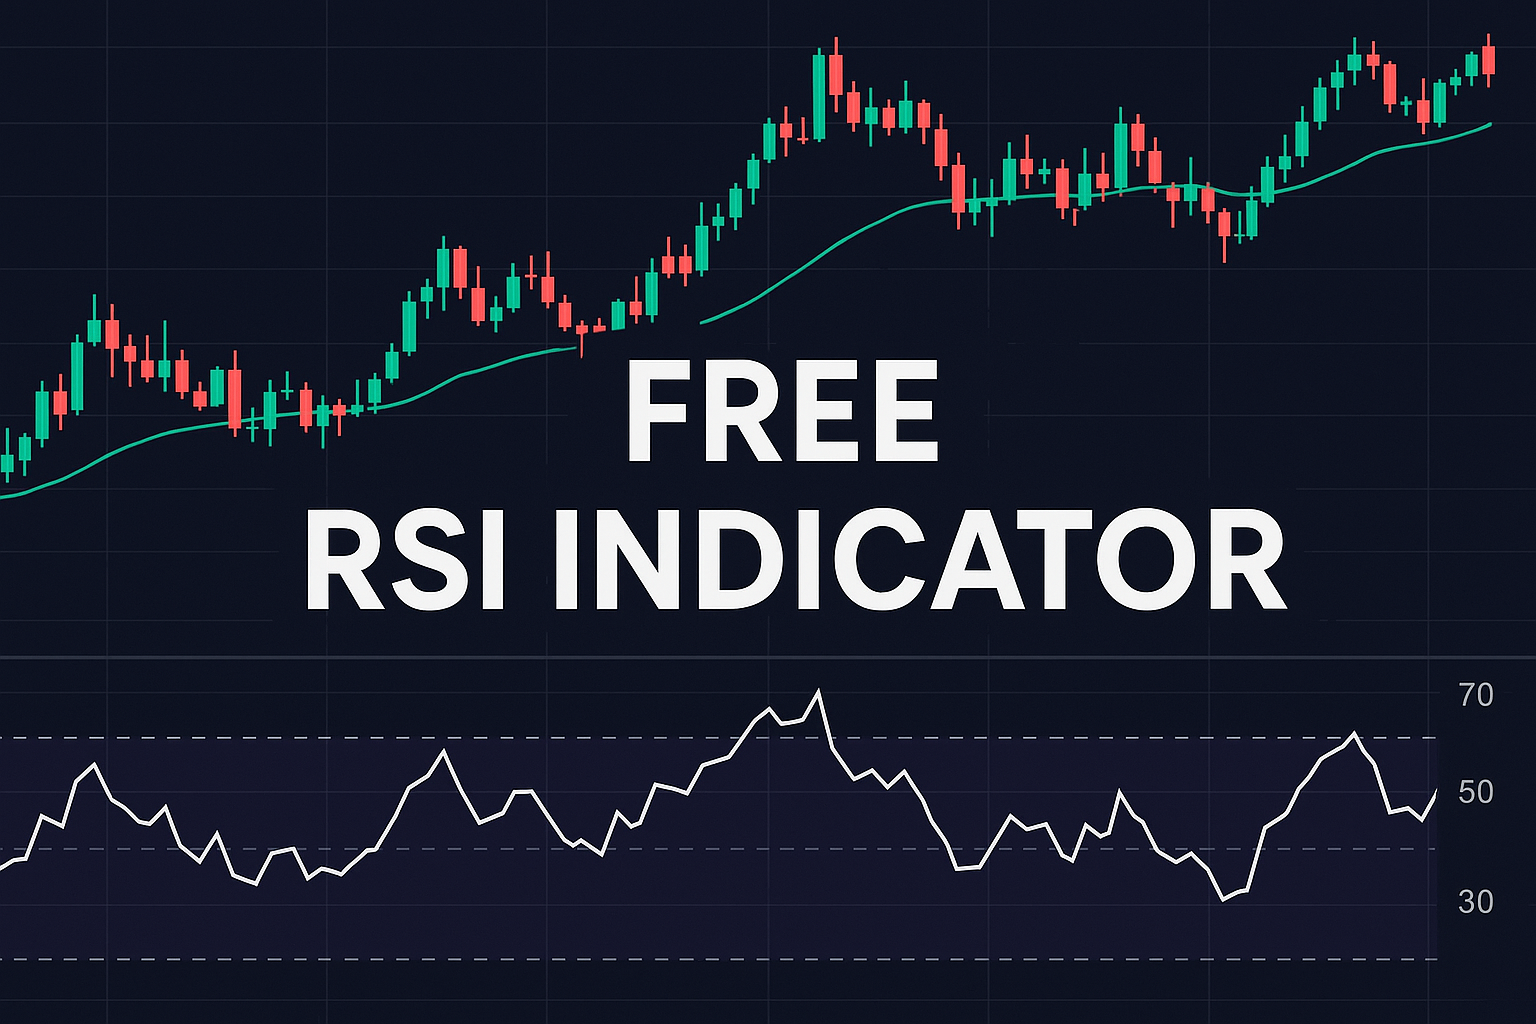
he Relative Strength Index (RSI) is one of the most widely used tools in stock trading. Whether you’re day trading or investing long term, the RSI can help you identify overbought and oversold conditions with clarity.
This guide covers the best RSI settings for stock trading and practical strategies to use it effectively.
Why Use RSI for Stocks?
- Clear buy/sell zones using the 70/30 rule
- Works on any timeframe – intraday, swing, positional
- Quick decision-making based on momentum
- Helps avoid emotional trades
RSI is especially useful in stocks because of their cyclical nature and pattern-driven behavior.
Best RSI Settings for Stocks
✅ Default Setting:
- RSI Length: 14
- Overbought: 70
- Oversold: 30
⚡ For Intraday Trading:
- Use RSI 9 or RSI 7 for faster signals
- Combine with 5-minute or 15-minute charts
🔒 For Swing/Positional Trading:
- Stick with RSI 14 on daily or weekly charts
- Use RSI for entry/exit filtering
RSI Trading Strategy for Stocks
1. Buy Signal Setup
- RSI drops below 30 (oversold)
- Price bounces from a support zone
- RSI crosses back above 30 → Buy Confirmation
2. Sell Signal Setup
- RSI goes above 70 (overbought)
- Price hits resistance
- RSI crosses below 70 → Sell Confirmation
3. Bonus: RSI Divergence
- Price makes higher highs but RSI makes lower highs → Bearish divergence
- Price makes lower lows but RSI makes higher lows → Bullish divergence
These setups are powerful signals for reversals.
Example Scenario
- Stock XYZ RSI falls to 25 during a market correction
- Price hits a previous support zone
- RSI starts climbing and crosses 30
- Volume confirms the bounce → Entry signal
This kind of confirmation-based trading increases your win rate.
Common Mistakes to Avoid
- Relying only on RSI without checking support/resistance
- Trading every overbought/oversold condition blindly
- Using RSI in strong trends without context
Conclusion
RSI is a powerful indicator for stock traders at all levels. When combined with price action and trend analysis, it can improve entry timing and reduce bad trades.
🔍 FAQs
Is RSI 14 good for stocks?
Yes — it’s the default setting and widely used by swing traders and investors.
Can I use RSI for intraday trading stocks?
Absolutely. Just reduce the period to 7 or 9 for faster signals.
Which timeframes are best for RSI in stock trading?
Daily for swing, 5M/15M for intraday, and weekly for long-term analysis.