RSI Indicator on TradingView – Step-by-Step Setup and Usage Guide
TradingView is one of the most popular charting platforms for traders — and adding the RSI indicator takes just a few clicks.
In this guide, you’ll learn how to set up the RSI indicator on TradingView, how to customize its settings, and how to use it effectively.
Step 1: Open a Chart on TradingView
- Go to tradingview.com
- Sign in or create a free account
- Search any symbol (like BTCUSD, AAPL, EURUSD)
- Click on “Full-Featured Chart”
Step 2: Add the RSI Indicator
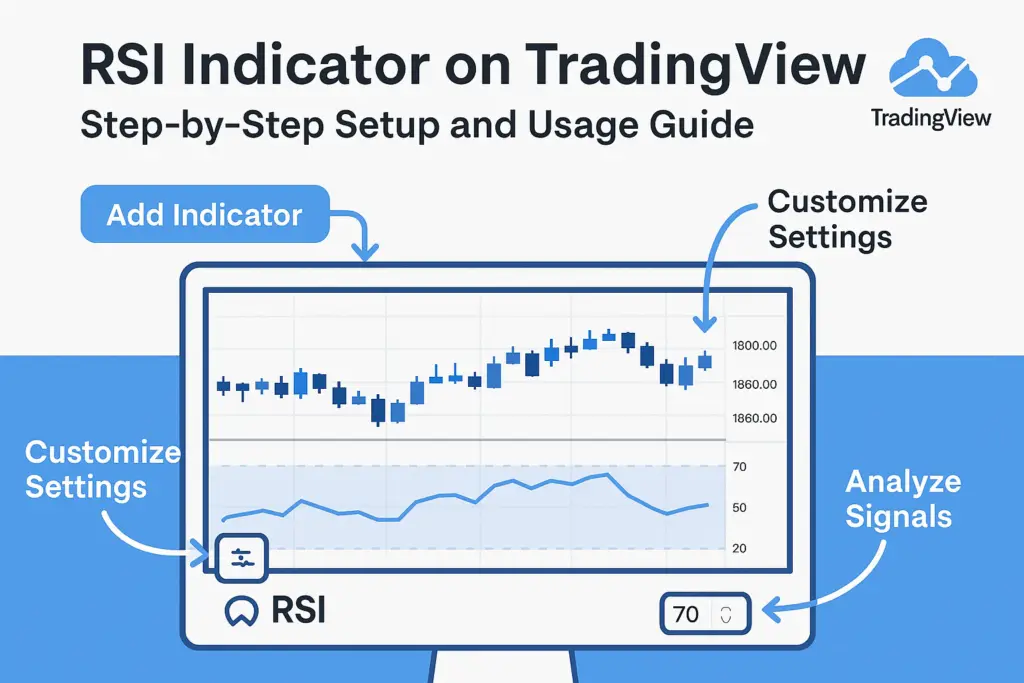
- Click on the “Indicators” icon at the top
- In the search bar, type “RSI”
- Select “Relative Strength Index” under “Built-ins”
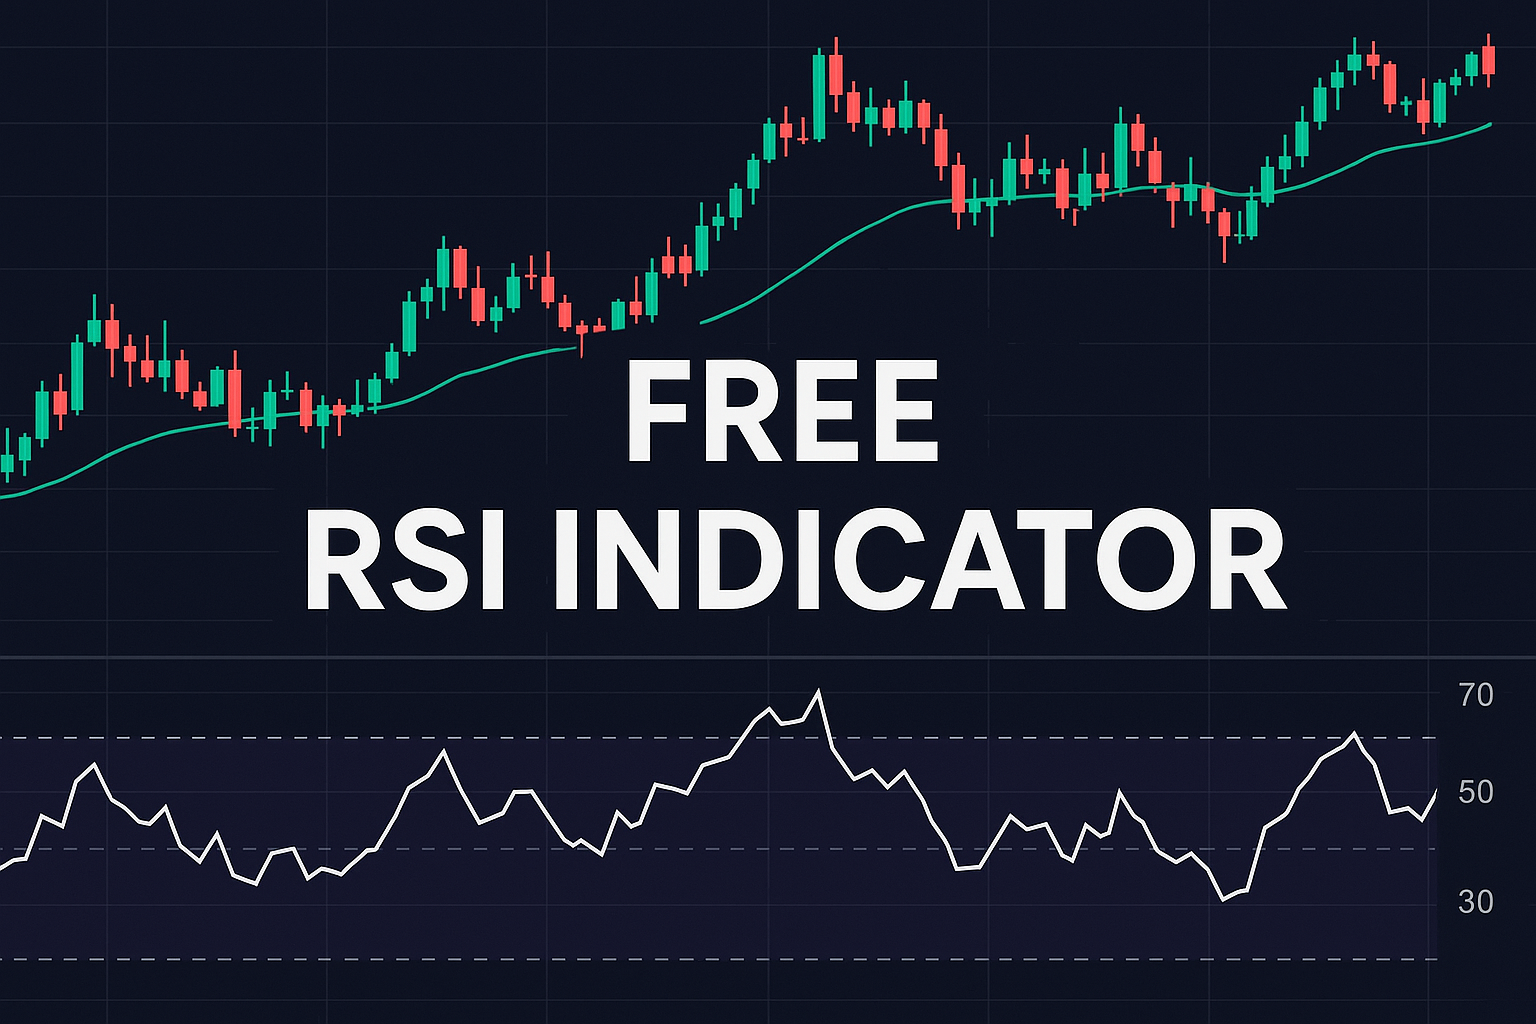
- The RSI panel will appear below your main price chart
Step 3: Customize RSI Settings
- Click the gear icon ⚙️ on the RSI pane
- Under “Inputs”, you can:
- Change the RSI length (default = 14)
- Under “Style”, you can:
- Change the color of the RSI line
- Adjust the overbought (70) and oversold (30) levels
👉 Tip: For crypto, you can use 9-period RSI with 80/20 levels for better accuracy.
Step 4: Read RSI on TradingView
- RSI above 70 = Overbought
- RSI below 30 = Oversold
- Cross back below 70 = Possible sell signal
- Cross back above 30 = Possible buy signal
The RSI line updates live with every candle, so you can use it in real time.
Step 5: Use RSI with Price Action
For better results:
- Combine RSI with support/resistance levels
- Use RSI divergence to spot early reversals
- Avoid trading RSI blindly during strong trends
Benefits of Using RSI on TradingView
- ✅ Free and easy to access
- ✅ Works across all assets (stocks, crypto, forex, futures)
- ✅ Customizable settings
- ✅ Clean, fast interface
Conclusion
TradingView makes it easy to use RSI in your daily trading. Whether you’re on a free or premium plan, this simple tool can help you spot momentum shifts and trade smarter.
🔍 FAQs
Can I use RSI on mobile TradingView?
Yes — the mobile app supports RSI with similar features.
What’s the best RSI setting on TradingView?
Start with 14-period, then test faster versions like 9 or 7 for scalping or crypto.
Can I use multiple RSIs on the same chart?
Yes — just add the indicator again and adjust the period for comparison.
