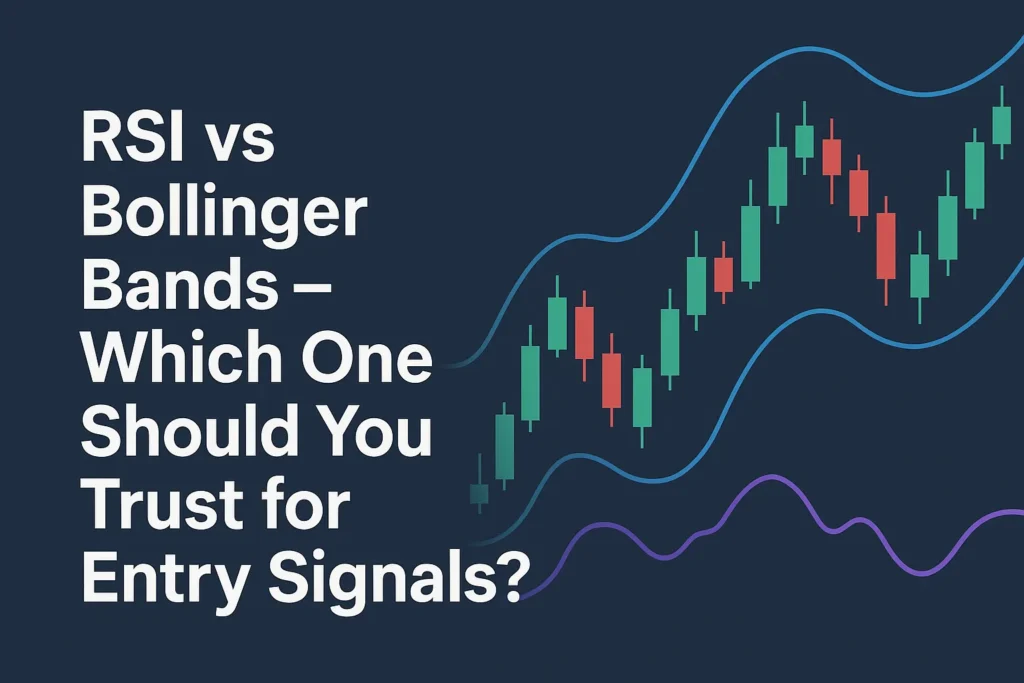
RSI and Bollinger Bands are both popular tools for spotting trade entries — but they work in very different ways.
In this post, we’ll compare RSI vs Bollinger Bands, explain how each works, and help you decide which to use based on your trading style and market conditions.
What is RSI?
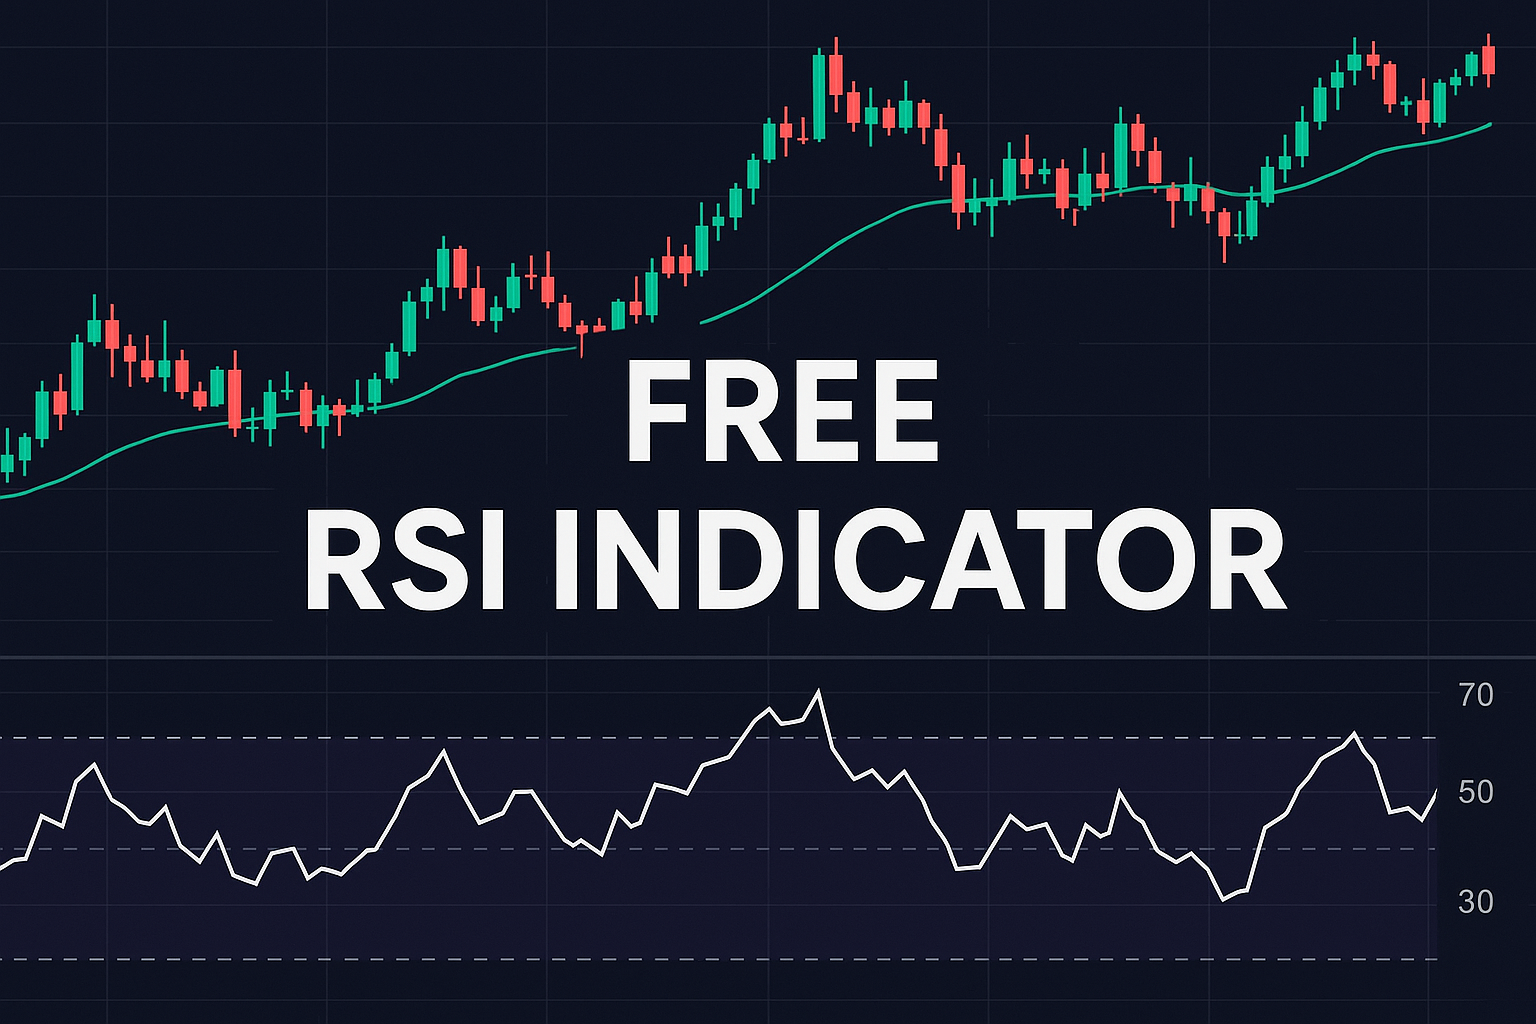
RSI (Relative Strength Index) is a momentum indicator that shows whether a market is overbought or oversold based on recent price changes.
- Value Range: 0 to 100
- Key Levels: 70 (overbought), 30 (oversold)
- Best For: Timing reversals and spotting momentum shifts
What Are Bollinger Bands?
Bollinger Bands are volatility-based bands plotted above and below a simple moving average (SMA).
- Default Setting: 20-period SMA ± 2 standard deviations
- Price tends to return to the middle band after hitting upper/lower bands
- Best For: Spotting volatility squeezes, breakout setups, and mean reversion
RSI vs Bollinger Bands – Key Differences
| Feature | RSI | Bollinger Bands |
|---|---|---|
| Type | Momentum Oscillator | Volatility Indicator |
| Visual Style | Single Line (0–100) | Three Bands (Upper, Middle, Lower) |
| Signals | Overbought/Oversold zones | Band touch, squeeze, or breakout |
| Best Use | Reversal timing | Volatility expansion/contraction |
| Reaction Speed | Reactive to price momentum | Reactive to price + volatility |
| Ideal Conditions | Trending or sideways markets | Sideways markets and breakouts |
When to Use RSI
✅ For clean momentum shifts
✅ To confirm trend exhaustion
✅ In range-bound markets
✅ For divergence setups
When to Use Bollinger Bands
✅ To detect volatility squeezes and breakouts
✅ To time entries near upper/lower bands
✅ For mean reversion strategies
✅ When volatility changes matter more than trend direction
Example Use Case
- RSI might show overbought conditions during a BTC rally (RSI > 70)
- Bollinger Bands may show the price hugging the upper band, indicating a possible breakout or reversal
Used together, they can confirm if the momentum and volatility setup align.
Can You Use RSI and Bollinger Bands Together?
Yes — many traders combine them.
Example Strategy:
- Price hits lower Bollinger Band
- RSI < 30 (oversold)
- Entry for potential reversal or bounce
This combo works well in range-bound or choppy markets.
Conclusion
RSI and Bollinger Bands both have their place in trading.
- Use RSI to gauge momentum and reversal zones
- Use Bollinger Bands to detect volatility-based trade setups
Combined, they offer a well-rounded view of market strength and movement.
🔍 FAQs
Is RSI better than Bollinger Bands?
Not better — just different. RSI tracks momentum, while Bollinger Bands measure volatility.
Can I use RSI and Bollinger Bands at the same time?
Yes. They complement each other well for timing reversals and breakout trades.
Which is better for scalping?
Bollinger Bands are more visual and responsive to short-term volatility. RSI helps confirm momentum.
