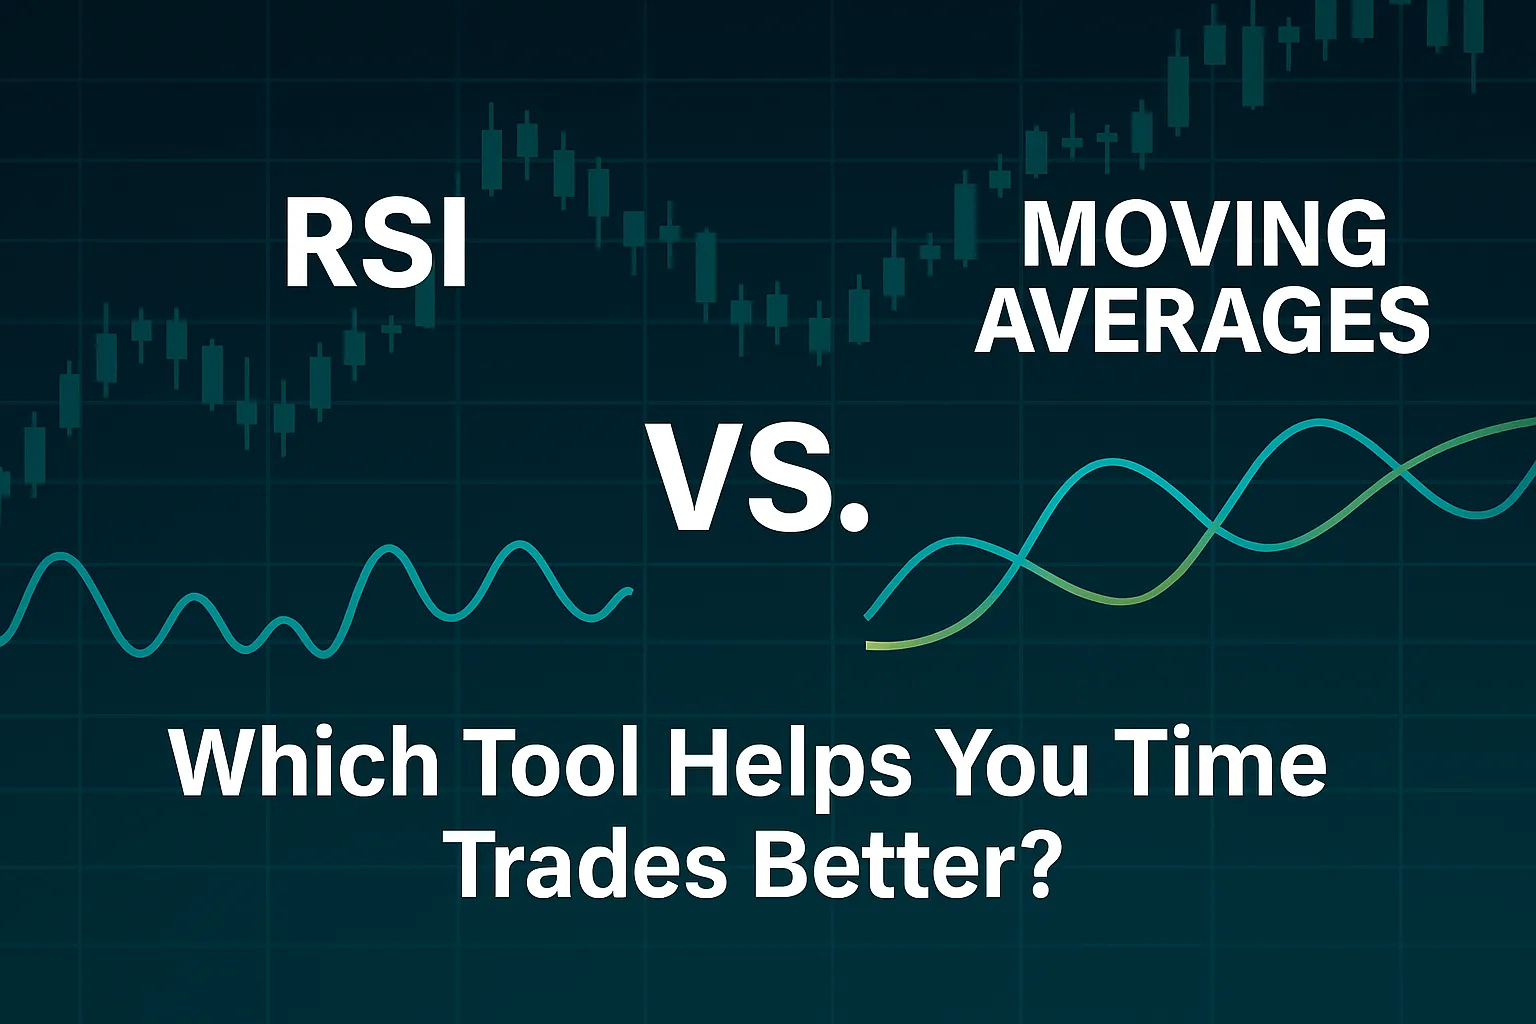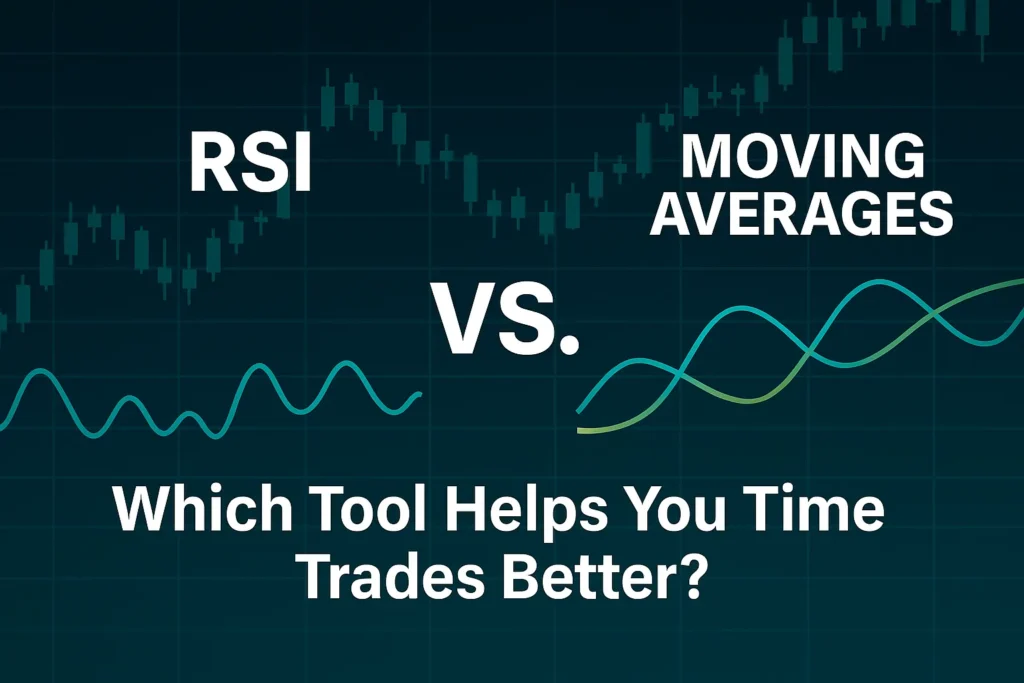
Both RSI and Moving Averages are powerful trading tools — but they serve different purposes. One measures momentum, while the other smooths out price data to identify trend direction.
In this post, we compare RSI vs Moving Averages and help you decide which one to use based on your goals and strategy.
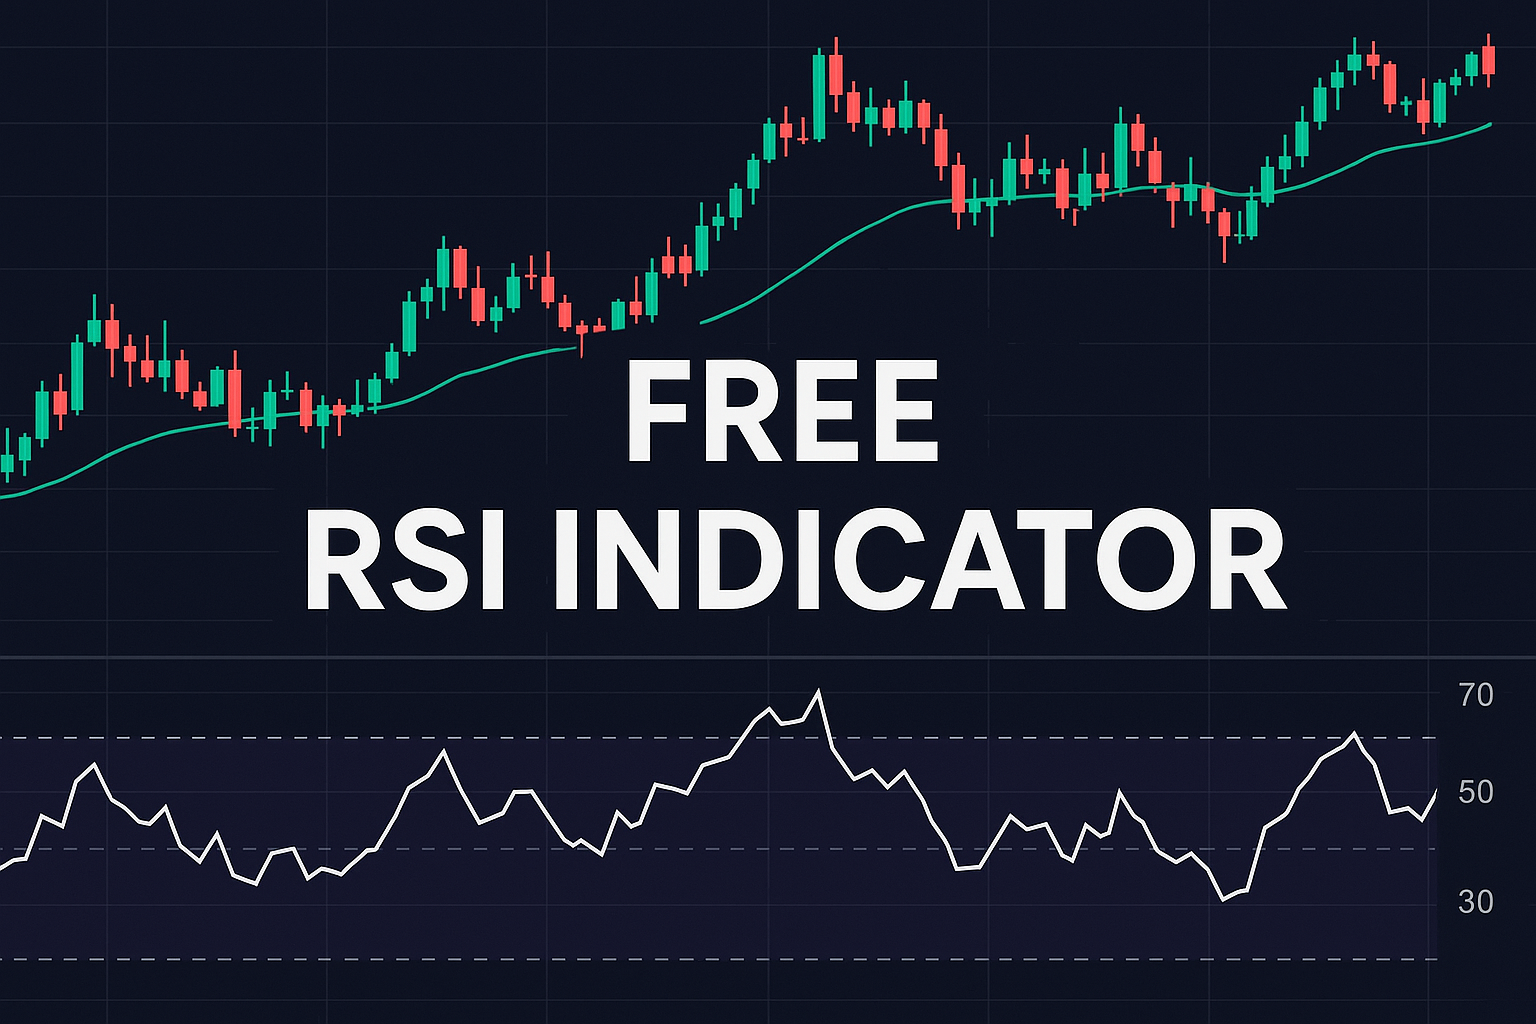
What is RSI?
The Relative Strength Index (RSI) is a momentum oscillator that tracks how quickly and strongly price has moved over a certain number of periods.
- Value Range: 0 to 100
- Overbought: Above 70
- Oversold: Below 30
- Best For: Spotting short-term reversals and momentum shifts
What Are Moving Averages?
Moving Averages (MAs) are trend-following indicators that calculate the average closing price over a specific period.
- Simple Moving Average (SMA): Straight average of prices
- Exponential Moving Average (EMA): Gives more weight to recent prices
- Best For: Identifying trend direction and support/resistance zones
RSI vs Moving Averages – Key Differences
| Feature | RSI | Moving Averages |
|---|---|---|
| Type | Momentum Oscillator | Trend-Following Indicator |
| Best For | Entry timing and momentum signals | Trend confirmation and filtering |
| Display | Line below chart (0–100) | Line(s) plotted on price chart |
| Speed | Fast and reactive | Slower, more stable |
| Signals | Overbought/Oversold, Divergence | Crossovers, Price >/< MA |
| Works Well In | Range-bound markets | Trending markets |
When to Use RSI
✅ To identify short-term exhaustion in price
✅ To time reversals or quick bounce entries
✅ To spot divergence before price changes
✅ To avoid buying at the top or selling at the bottom
When to Use Moving Averages
✅ To confirm trend direction (e.g. 50 EMA above 200 EMA = uptrend)
✅ To ride trends with fewer signals
✅ To filter out choppy market noise
✅ To define dynamic support and resistance zones
Can You Use Both Together?
Yes — and many traders do.
Example:
- RSI shows oversold at a key support zone
- Price is above 200 EMA (long-term uptrend)
- RSI reversal + trend direction = high-probability long setup
Popular MA Combinations:
- 50 EMA + 200 EMA: Golden/Death Cross signals
- 9 EMA + 21 EMA: Scalping & short-term confirmation
- Price + 200 SMA: Trend continuation filter
Conclusion
RSI and Moving Averages are not competitors — they’re complementary.
- Use RSI to spot potential reversals and overextensions
- Use Moving Averages to stay aligned with the trend and avoid fake signals
- Combine both for a powerful trading system
🔍 FAQs
Is RSI better than moving averages?
Not necessarily — RSI is faster and ideal for timing entries. Moving averages are better for staying in trends.
Can RSI predict trend direction?
Not directly — it shows momentum shifts, but not overall trend.
Which is best for beginners?
Both are beginner-friendly. Start with 14-period RSI and 50/200 moving averages.