The RSI Indicator (Relative Strength Index) is one of the most popular technical indicators used by traders around the world. Whether you’re trading stocks, crypto, forex, or futures, understanding RSI can help you make smarter entry and exit decisions
What is RSI?
RSI stands for Relative Strength Index. It’s a momentum oscillator developed by J. Welles Wilder to measure the speed and change of price movements.
It ranges from 0 to 100 and helps traders identify whether an asset is overbought (potentially due for a drop) or oversold (possibly ready to bounce).
RSI Formula (Explained Simply)
The formula is:
RSI = 100 – [100 / (1 + RS)]
Where:
RS = Average Gain over X periods / Average Loss over X periods
Most traders use 14 periods by default.
You don’t need to calculate it manually — charting platforms like TradingView do it automatically.
RSI Value Interpretation
- Above 70 = Overbought zone (price may fall)
- Below 30 = Oversold zone (price may rise)
- Between 30–70 = Neutral or trend continuation zone
Why Traders Use RSI Indicator
- Identify potential reversals
- Confirm trend strength
- Filter out bad trades
- Time entries and exits are more precise
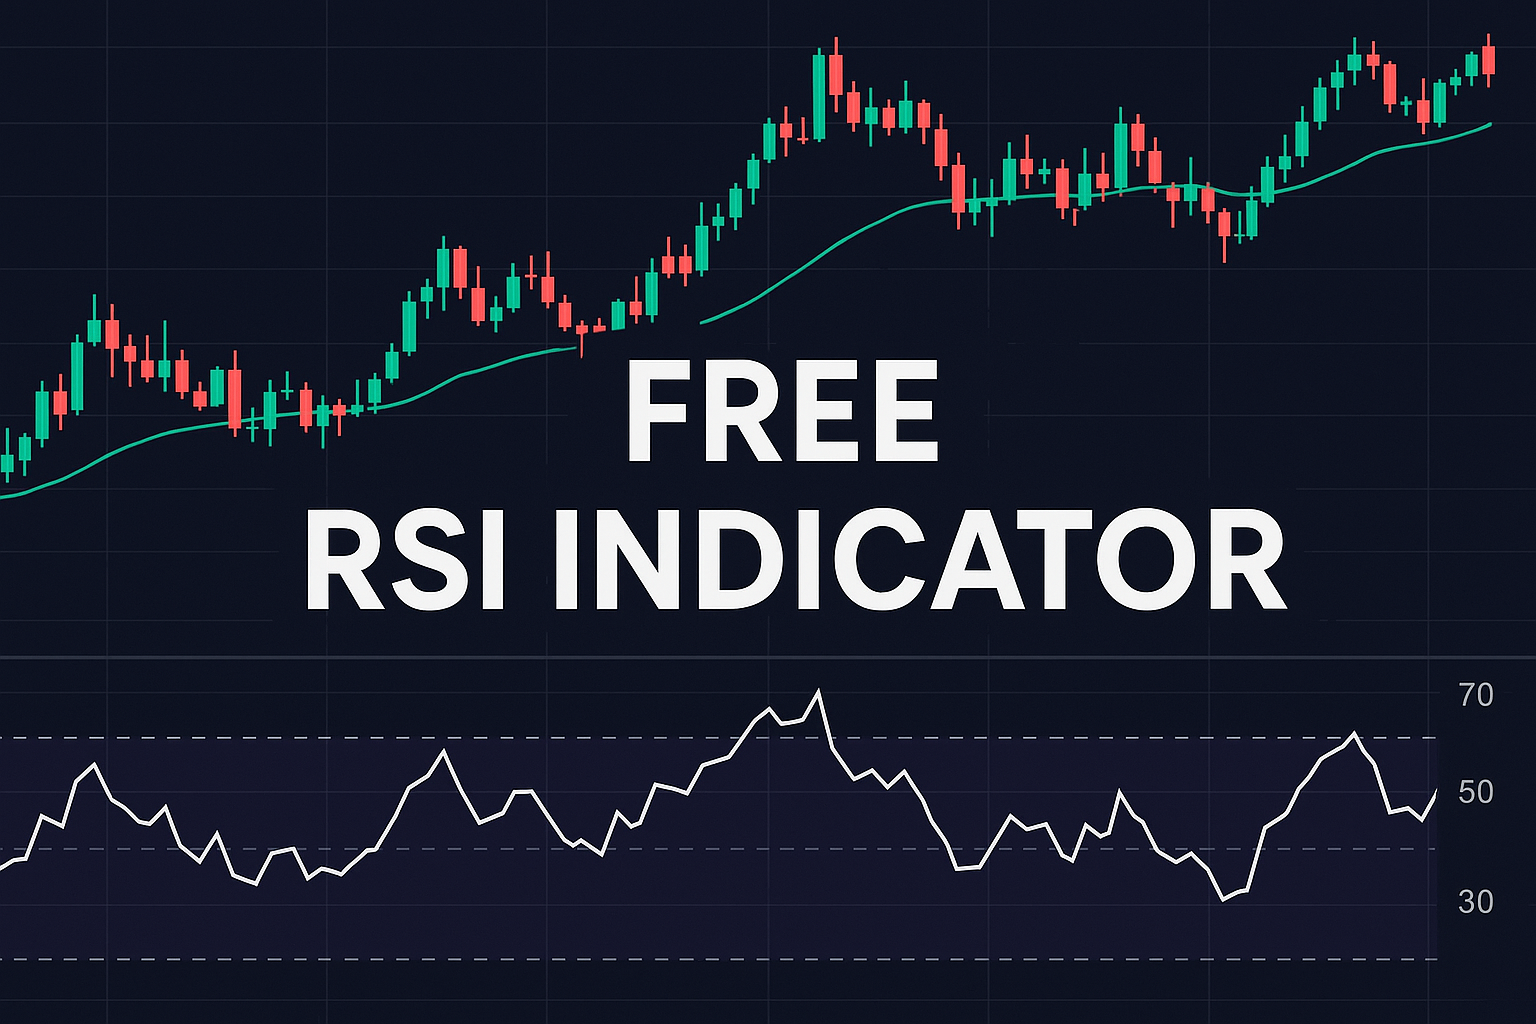
How to Read RSI Indicator on a Chart
Platforms like TradingView display RSI as a line below the price chart. When the RSI line crosses 70, it’s considered overbought. When it drops below 30, it’s oversold.
In sideways markets, RSI is very effective in identifying bounce zones.
When RSI Works Best
RSI performs best in range-bound markets — where price moves between support and resistance levels. In strong trends, RSI may stay overbought or oversold for extended periods.
Always use it in combination with price action or support/resistance levels for confirmation.
Final Thoughts
RSI is a simple yet powerful tool for any beginner trader. Mastering it gives you an edge in spotting market extremes and planning your trades more logically.
What does RSI 14 mean?
It refers to the RSI calculated using the last 14 periods (candles).
What is a good RSI value?
That depends on the context, but 30 and 70 are the most commonly used trigger levels.
Can RSI be used alone?
It’s better used alongside price action or other confirmation tools.
Who invented RSI?
J. Welles Wilder, a mechanical engineer and market technician.
Is RSI a lagging or leading indicator?
RSI is a lagging indicator — it reacts to price, not predicts it.